
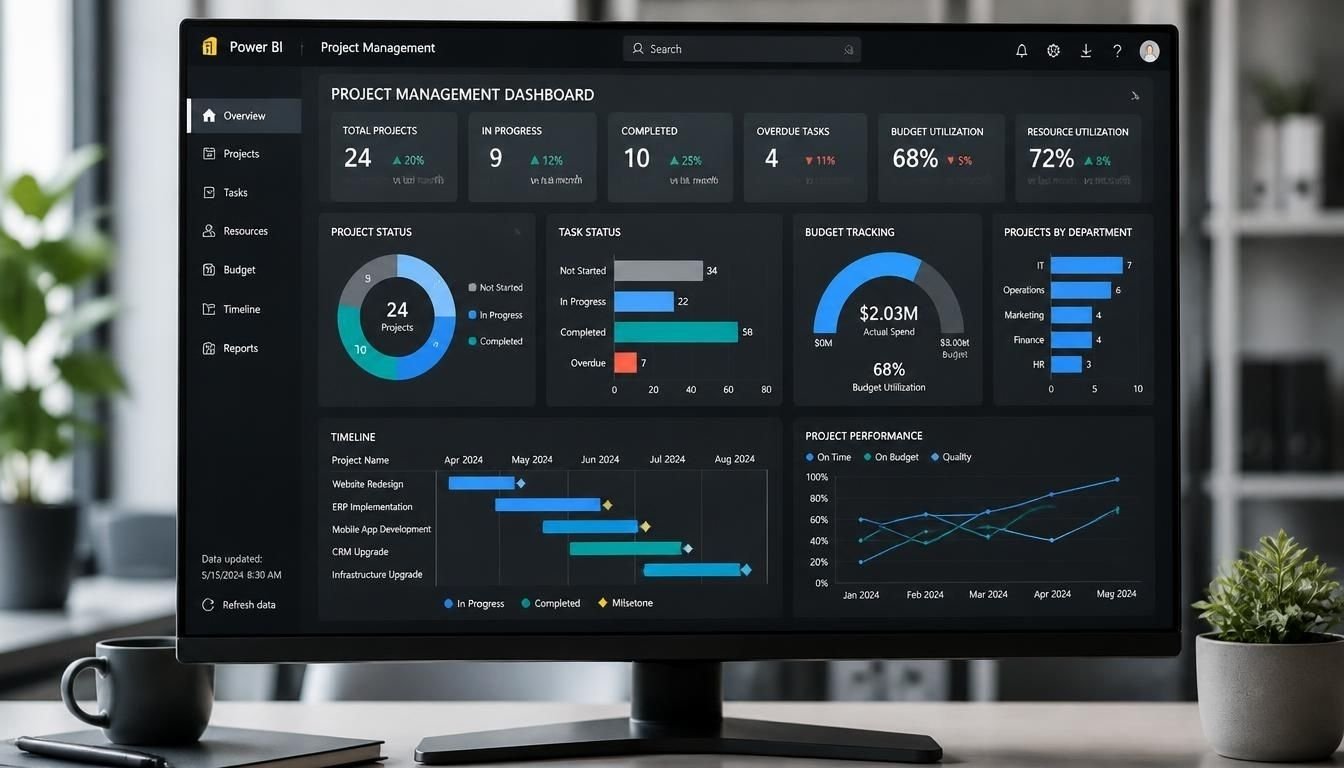
A power bi project management dashboard native solution allows project managers to monitor schedules, task completion, budgets and team performance using the visualization features already available in Microsoft Power BI.
Instead of purchasing specialized dashboard extensions or relying on complicated third-party visuals, teams can build an interactive reporting solution with standard Power BI components.
The dashboard can bring information from Excel workbooks, Microsoft Lists, SharePoint and business databases into one reporting environment. Project managers can then review progress, identify delayed activities and compare planned performance against actual results.
However, building a useful dashboard requires more than adding charts to a report. The underlying project data must be organized properly, performance indicators must use consistent calculations and every visual should answer a specific management question.
Key Takeaways
- Power BI can create project management dashboards using built-in visuals without requiring third-party chart extensions.
- A useful dashboard should track project health, task progress, deadlines, budgets, risks and resource allocation.
- Excel, Microsoft Lists, SharePoint and SQL databases can provide the project data needed for reporting.
- Power Query and DAX help transform project information into meaningful performance indicators.
- Power BI is best used for project reporting and analysis rather than replacing dedicated project management software.
What Does a Native Power BI Project Management Dashboard Include?
A native dashboard uses Power BI’s built-in reporting and visualization capabilities to present project information.
It can provide a consolidated view of multiple projects while allowing managers to investigate individual tasks, departments and reporting periods.
A typical implementation includes the following components.
| Component | Information displayed | Management purpose |
|---|---|---|
| Project overview | Active, completed and delayed projects | Monitor portfolio health |
| Task tracking | Task status and completion percentage | Identify unfinished work |
| Project timeline | Start dates, deadlines and milestones | Monitor schedule performance |
| Budget monitoring | Planned and actual expenses | Identify financial variances |
| Resource allocation | Assigned hours and available capacity | Identify workload problems |
| Risk monitoring | Risk levels and unresolved issues | Prioritize corrective actions |
| Project performance | Planned versus actual progress | Evaluate delivery performance |
The exact layout depends on the organization’s project management process.
For example, a construction company may prioritize project costs, milestone completion and schedule delays. An IT department may focus more on sprint progress, outstanding tasks and resource utilization.
The objective is to provide the information managers need without making them navigate several disconnected spreadsheets.
Native Power BI Visuals for Project Management
Power BI includes several standard visual types that can support project reporting without requiring custom visual extensions.
Choosing the right visual is important because different project metrics require different presentation methods.
1. KPI Cards for Project Performance
Card visuals display important project indicators in a compact format.
Useful metrics include:
- Total active projects
- Completed projects
- Delayed projects
- Average task completion
- Total project budget
- Actual project spending
- Overdue tasks
For example, a project manager can see that 12 projects are active and 3 are delayed without reviewing individual project records.
KPI cards should highlight important information rather than display every available metric.
2. Bar and Column Charts for Task Status
Bar and column charts help managers compare task distribution across different categories.
Common applications include:
- Tasks by project
- Completed versus pending tasks
- Tasks by priority
- Delayed activities by department
- Project performance by manager
A stacked bar chart can also show how different task statuses contribute to the total workload.
3. Line Charts for Project Trends
Line charts are useful when managers need to understand how project performance changes over time.
They can display:
- Weekly task completion
- Monthly project expenditure
- Cumulative progress
- Actual versus planned performance
- Historical overdue task counts
A trend chart is particularly useful because a single reporting date does not explain whether performance is improving or deteriorating.
4. Matrix Visuals for Detailed Project Tracking
Matrix visuals are useful for organizing projects, phases and individual tasks into a structured hierarchy.
A practical layout could include:
| Project | Task | Owner | Status | Completion |
|---|---|---|---|---|
| Website Redesign | Research | Sarah | Completed | 100% |
| Website Redesign | Design | Michael | In Progress | 65% |
| Website Redesign | Development | James | Not Started | 0% |
| CRM Implementation | Data Migration | Emily | In Progress | 40% |
Conditional formatting can highlight overdue activities, low completion rates and high-priority tasks.
Managers can also expand project-level records to inspect individual activities.
5. Native Timeline Reporting
Power BI does not include a dedicated built-in Gantt chart visual in its standard visual collection.
However, teams can create a basic timeline presentation using native visuals such as tables, matrices, bar charts and conditional formatting.
For example, a matrix can display tasks against reporting dates, with formatting indicating the planned duration and current progress.
This approach is useful for basic project schedule monitoring.
For complex scheduling requirements involving task dependencies, critical paths and advanced timeline interactions, a dedicated scheduling tool or specialized visual may be more appropriate.
How to Build a Native Project Management Dashboard in Power BI
Building a reliable reporting solution starts with the data rather than the visual design.
The following process provides a practical foundation for organizations that want to create their own reporting environment.
Step 1. Prepare the Project Management Data
Start by identifying the information required to monitor projects.
A basic project tracking workbook should contain a project table and a task table.
Project data
| Project ID | Project Name | Manager | Start Date | End Date | Budget |
|---|---|---|---|---|---|
| P001 | Website Redesign | Sarah | 01/01/2026 | 03/31/2026 | $25,000 |
| P002 | CRM Implementation | Michael | 02/01/2026 | 05/30/2026 | $40,000 |
Task data
| Task ID | Project ID | Task Name | Assigned To | Status | Progress |
|---|---|---|---|---|---|
| T001 | P001 | Research | James | Completed | 100% |
| T002 | P001 | Design | Emily | In Progress | 65% |
| T003 | P002 | Data Migration | Sarah | Not Started | 0% |
Additional information can include:
- Planned and actual start dates
- Task deadlines
- Estimated and actual costs
- Assigned working hours
- Priority levels
- Risk categories
- Milestone dates
Keep project information consistent across all data sources.
For example, the same project should use the same Project ID in its project, task and expense records.
Step 2. Connect Your Data to Power BI Desktop
Open Power BI Desktop and select the Get Data option.
Choose the appropriate connection based on where the project information is stored.
Common options include:
| Data source | Suitable application |
|---|---|
| Excel | Small project tracking systems |
| SharePoint Lists | Shared team project records |
| Microsoft Lists | Task and project tracking |
| SQL Server | Larger structured databases |
| CSV files | Simple data imports |
| Dataverse | Business applications and structured records |
After connecting the source, open Power Query to inspect the imported information.
Remove unnecessary columns, correct data types, standardize project names and handle missing values.
Date fields should use proper date formats. Financial fields should use suitable numeric or currency formats.
These steps reduce calculation errors and improve reporting consistency.
Step 3. Create the Data Model
A well-structured data model makes the dashboard easier to maintain.
Instead of combining every project field into one large table, organize information into related tables.
A practical model can include:
- Projects
- Tasks
- Employees
- Dates
- Project Expenses
- Project Risks
Create relationships using unique identifiers.
For example, the Project ID connects the Projects table with the Tasks table.
The Employee ID connects task assignments with the Employees table.
A separate calendar table allows managers to analyze performance across different reporting periods.
A simple relationship structure looks like this:
             Projects
                |
                |
              Tasks
             /     \
            /       \
      Employees    Dates
            \
             \
          Expenses
The exact relationship design depends on how the source data is organized.
Avoid unnecessary many-to-many relationships because they can make calculations harder to understand.
Step 4. Create Project Management Measures Using DAX
DAX measures convert project records into useful performance indicators.
The following examples assume that the data model contains a Tasks table with the relevant fields.
Total Projects
Total Projects =
DISTINCTCOUNT(Projects[Project ID])
Completed Tasks
Completed Tasks =
CALCULATE(
    COUNTROWS(Tasks),
    Tasks[Status] = "Completed"
)
Overdue Tasks
Overdue Tasks =
CALCULATE(
    COUNTROWS(Tasks),
    Tasks[Due Date] < TODAY(),
    Tasks[Status] <> "Completed"
)
Average Task Completion
Average Completion =
AVERAGE(Tasks[Progress])
This assumes the Progress column stores values between 0 and 1. If it stores percentages between 0 and 100, the measure can be adjusted accordingly.
Total Project Budget
Total Budget =
SUM(Projects[Budget])
Actual Project Cost
Actual Cost =
SUM(Expenses[Actual Cost])
Budget Variance
Budget Variance =
[Total Budget] - [Actual Cost]
A positive result indicates that actual spending is below the total budget. A negative result indicates that spending has exceeded it.
These measures provide a foundation for the dashboard. More advanced reporting may require additional calculations for forecast costs, schedule variance and earned value management.
Step 5. Design the Dashboard Layout
A useful reporting layout should follow the way project managers review information.
A practical structure includes three reporting pages.
Page 1: Executive Project Overview
Display:
- Total projects
- Active projects
- Completed projects
- Delayed projects
- Total budget
- Actual spending
- Project status distribution
- Project performance summary
This page provides an overall view for executives and project sponsors.
Page 2: Project and Task Tracking
Include:
- Project selection
- Task status breakdown
- Task completion percentages
- Assigned team members
- Overdue activities
- Upcoming deadlines
- Detailed project task matrix
This page supports day-to-day project monitoring.
Page 3: Budget and Resource Performance
Include:
- Budget versus actual spending
- Cost variance
- Employee workload
- Assigned hours
- Remaining effort
- Project expenses over time
This page helps project managers investigate resource and financial performance.
Keep the most important indicators near the top of each page. Place detailed information below them.
Step 6. Add Interactive Filters
Interactive filters allow users to investigate specific parts of the project portfolio.
Useful slicers include:
- Project name
- Project manager
- Department
- Task status
- Priority
- Reporting period
For example, an executive can select a particular department and review only its active projects.
A project manager can select an individual project to investigate its tasks, expenses and deadlines.
Make sure the relationships and visual interactions work correctly. A filter that changes one chart but leaves related project indicators unchanged can create confusing results.
Step 7. Publish and Configure Data Refresh
Once the report is ready, publish it to the Power BI service.
Configure access permissions and select an appropriate workspace.
For connected cloud data sources, configure the required authentication and refresh settings.
For on-premises data sources, a properly configured data gateway may be necessary.
Test the published report before distributing it to the team.
Check that:
- All project records are included.
- Financial calculations match the source data.
- Project deadlines display correctly.
- Filters work as expected.
- Users have appropriate permissions.
- Refresh failures are identified and resolved.
This final step ensures that managers are not making decisions using outdated or incomplete information.
Important KPIs for Project Management Reporting
Choosing the right KPIs is more important than displaying a large number of charts.
Every indicator should provide information that supports a management decision.
| KPI | What it measures | Why it matters |
|---|---|---|
| Project completion | Overall delivery progress | Measures project advancement |
| Task completion rate | Completed tasks against total tasks | Shows execution progress |
| Schedule variance | Difference between planned and actual schedule performance | Identifies delays |
| Budget variance | Difference between budget and actual cost | Monitors financial performance |
| Overdue tasks | Unfinished tasks past their deadlines | Highlights delivery problems |
| Resource utilization | Assigned effort compared with available capacity | Identifies workload pressure |
| Milestone completion | Milestones achieved against planned milestones | Measures major delivery progress |
| Risk exposure | Number and severity of open risks | Supports risk prioritization |
Understanding Schedule and Cost Performance
Organizations running larger projects may benefit from Earned Value Management.
This approach combines schedule and financial information to provide a more complete view of project performance.
Three important measures include:
- Planned Value (PV): The budgeted value of work scheduled by a specific date.
- Earned Value (EV): The budgeted value of work actually completed.
- Actual Cost (AC): The amount spent on the completed work.
Two useful performance indicators are:
Schedule Performance Index
\[ SPI = \frac{EV}{PV} \]
Cost Performance Index
\[ CPI = \frac{EV}{AC} \]
An SPI above 1 indicates that completed work is ahead of the planned schedule in earned-value terms.
A CPI above 1 indicates that the project is earning more budgeted value per dollar spent than planned.
These indicators require reliable baseline, progress and cost records. They should not be calculated from incomplete task percentages alone.
Native Power BI Dashboard vs Third-Party Visuals
One important decision is whether to build the reporting environment using only standard Power BI visuals or introduce additional visual extensions.
Both approaches have advantages.
| Evaluation factor | Native Power BI visuals | Third-party visuals |
|---|---|---|
| Initial setup | Generally straightforward | May require additional configuration |
| Customization | Standard formatting options | Depends on the visual |
| Gantt reporting | Requires a workaround | Dedicated Gantt options may be available |
| Maintenance | Uses built-in Power BI components | May depend on external developers |
| Licensing | No separate visual purchase for standard visuals | Some require paid licenses |
| Compatibility | Standard Power BI environment | Depends on visual support |
| Advanced interactions | Depends on standard visual capabilities | May offer specialized functionality |
Native visuals are a sensible starting point for organizations that need standard reporting, cost tracking, task monitoring and portfolio analysis.
Third-party visuals become more useful when the organization requires specialized functionality that cannot be represented effectively with standard components.
However, adding more visuals does not automatically make a dashboard more useful.
When Should You Choose a Native Power BI Dashboard?
A native reporting solution is not suitable for every project management requirement.
The decision should depend on the organization’s existing systems, reporting needs and operational processes.
Choose Native Power BI Visuals When:
- Your organization already uses Excel, SharePoint or Microsoft Lists.
- You need to consolidate information from multiple projects.
- Management wants a consistent portfolio overview.
- You need budget and performance reporting.
- Your reporting requirements can be handled with standard charts, tables and matrices.
- You want to avoid additional visual dependencies.
Consider Third-Party Visuals When:
- You need advanced Gantt chart interactions.
- Your project timelines require specialized visualization.
- Standard charts cannot communicate the required information clearly.
- You need more advanced drill-down or timeline functionality.
Before purchasing an extension, check its licensing, data handling, compatibility and update policy.
Use Dedicated Project Management Software When:
- Team members need to create and update tasks.
- Managers need to assign responsibilities.
- Projects require automated approval workflows.
- Teams depend on task notifications and collaboration.
- Schedules require dependency management and critical path calculations.
Power BI primarily analyzes and presents project information. It does not automatically provide a complete task management system.
A practical arrangement is to maintain operational project information in Microsoft Planner, Microsoft Project or another project management platform and use Power BI for consolidated reporting.
This separates daily project execution from management analysis.
Common Mistakes When Building a Native Project Management Dashboard
Even a well-designed report can produce misleading information when the underlying model or calculations are incorrect.
Watch for these common problems.
1. Using inconsistent project identifiers
If different spreadsheets use different identifiers for the same project, relationships may fail and totals may become inaccurate.
Use consistent project IDs across all connected records.
2. Treating task completion as overall project health
A project can have 90% of its tasks completed and still be delayed because one critical milestone remains unfinished.
Consider task importance, dependencies and milestone performance rather than relying exclusively on average completion.
3. Ignoring historical project data
Overwriting previous status records makes it difficult to understand how project performance has changed.
Maintain dated status snapshots when historical comparisons are important.
4. Displaying too many KPIs
Too many cards and charts make it harder for managers to identify important problems.
Prioritize indicators that support specific decisions.
5. Confusing refresh frequency with real-time reporting
A dashboard only reflects the latest available source data.
Scheduled refreshes, DirectQuery and other connection methods have different update behaviors. Choose the approach based on how frequently the underlying project information changes.
6. Ignoring security requirements
Project budgets, employee information and financial records may require restricted access.
Use appropriate workspace permissions and row-level security when different users should see different project information.
Frequently Asked Questions
Can I build a Power BI project management dashboard using only native visuals?
Yes. You can use built-in Power BI cards, bar charts, line charts, tables, matrices and slicers to create a complete project reporting environment.
A basic timeline can also be developed with standard visuals, although advanced Gantt functionality may require additional solutions.
Does Power BI have a built-in project management dashboard template?
Power BI provides sample reports and Microsoft offers project-related reporting solutions. However, there is no universal native project management template that automatically fits every organization’s workflow.
Most teams need to customize their data model, KPIs and report layout.
Can Power BI track project deadlines and overdue tasks?
Yes. You can compare task due dates with the current date using DAX measures and display overdue activities in cards, tables and charts.
The source data must contain accurate deadlines and task completion statuses.
Can I connect Microsoft Planner to Power BI?
Yes. Project and task information from Microsoft Planner can be brought into Power BI using suitable Microsoft data integration options.
The connection method depends on the Planner environment and available interfaces. You may need Power Automate, Microsoft Graph or another supported integration method.
Is a native Power BI project management dashboard better than an Excel tracker?
It depends on the reporting requirements.
Excel is often sufficient for small projects with simple tracking needs. Power BI is more useful when information comes from multiple sources or managers need interactive portfolio reporting.
The two tools can also work together.
Can Power BI display multiple projects in one dashboard?
Yes. A properly structured data model can combine information from multiple projects.
Managers can review the entire portfolio and filter information by project name, department, manager or reporting period.
Does Power BI automatically update project status?
Not by itself. Power BI reads and analyzes information from connected data sources.
Task status changes must be recorded in the source system or through a separately configured write-back process. Refresh behavior determines when those changes appear in the report.
Can Power BI calculate project budget variance?
Yes. You can create DAX measures that compare approved project budgets with actual spending.
For more advanced financial reporting, you can also calculate forecast costs, cost performance indexes and earned value indicators when the required data is available.
Can I share a Power BI project dashboard with my team?
Yes. You can publish reports to the Power BI service and share them through supported workspaces, apps and permissions.
However, creating, sharing and viewing content may require different licensing arrangements. Check your organization’s Power BI licensing before distributing reports.
Choosing the Right Native Reporting Approach
A native Power BI project management solution is a practical choice when the main objective is to bring project information together and make performance easier to understand.
Start with a clean data model, a small set of meaningful KPIs and three core reporting areas covering project overview, task tracking and financial performance.
Use standard visuals wherever they meet the reporting requirements. Introduce specialized extensions only when a genuine functional gap exists.
Most importantly, keep project execution and project reporting connected but separate. Teams should have an effective system for managing their work, while managers should have a reliable reporting environment for understanding progress, identifying risks and making informed decisions.