
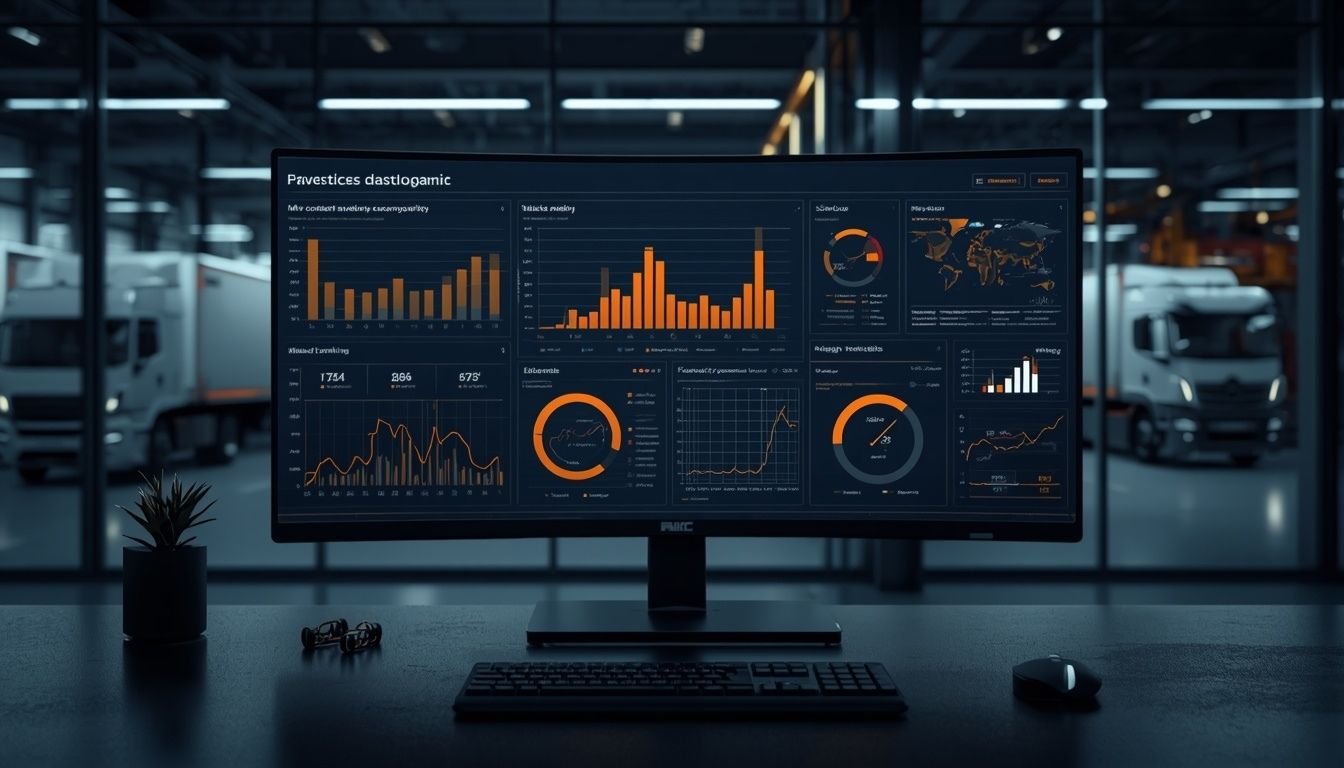
Vortex Group of Companies reporting dashboard needs center on bringing financial performance, freight operations, customer activity and company-wide results into one reliable reporting system. For a logistics organization operating across multiple terminals and transportation services, disconnected reports can make it harder to identify delays, control costs and understand which parts of the business perform best.
A well-designed dashboard should help executives understand overall performance while giving finance teams, dispatchers and operations managers the information they need for daily decisions. The goal is not to display more numbers. It is to make important business information easier to access, compare and act on.
Key Takeaways
- A reporting dashboard should give Vortex Group leadership a clear view of financial and operational performance across its companies.
- Each business unit needs relevant metrics while leadership needs a consolidated group-wide view.
- Reliable reporting depends on consistent definitions and accurate data from connected business systems.
- Role-based access and clear reporting schedules help protect sensitive information and reduce reporting delays.
- The best dashboard design starts with specific business decisions rather than a long list of charts and metrics.
Why Does Vortex Need a Centralized Reporting Dashboard?
A group of companies or business units may use separate systems for accounting, transportation management, customer relationships, billing and workforce operations. Each system can provide useful information, but the full business picture becomes harder to understand when reports remain disconnected.
For a transportation and logistics group, this can create several challenges.
- Limited group-wide visibility: Leadership may need to combine reports to compare performance across business units or terminals.
- Delayed financial insights: Revenue and operating costs may become visible only after manual reporting and reconciliation.
- Unclear operational performance: Shipment delays, capacity utilization and service issues can remain hidden inside separate reports.
- Inconsistent metrics: Departments may calculate revenue, on-time delivery or operating costs differently.
- Slow decision-making: Managers spend time collecting information instead of investigating problems and improving performance.
A centralized dashboard can address these challenges by bringing approved data into a consistent reporting structure.
The dashboard should not replace every operational system. Instead, it should provide a shared reporting layer that uses reliable information from those systems.
What Should the Reporting Dashboard Include?
The most useful dashboard combines an executive overview with specialized reporting for finance, transportation, customers and operational teams.
Each section should answer a different business question.
1. Executive Performance Dashboard
Executives need a high-level view of business performance without reviewing every shipment or transaction.
The executive dashboard should show:
- Total revenue across the group
- Revenue and profit trends by business unit
- Operating expenses and margin performance
- Shipment volume and service performance
- Customer retention and account growth
- Performance against approved targets
- Major operational and financial exceptions
The dashboard should also support comparisons between current results, previous periods and business targets.
For example, if revenue increases while operating margins decline, leadership should be able to identify whether higher fuel expenses, subcontractor costs, lower pricing or another factor contributed to the change.
The figures should link to more detailed reports so managers can investigate the underlying cause.
2. Financial Reporting and Cost Control
Financial reporting is essential when leadership needs to understand profitability across multiple companies, locations or transportation services.
The financial dashboard should include:
- Revenue by company and service type
- Direct transportation costs
- Fuel and maintenance expenses
- Payroll and other operating expenses
- Gross profit and operating margin
- Accounts receivable and overdue invoices
- Accounts payable and upcoming obligations
- Budget versus actual performance
- Cash flow and working capital indicators
For a US logistics operation, costs may also need to be compared across domestic freight, cross-border shipments and different service categories.
The dashboard should distinguish billed revenue from recognized revenue and collected cash. These figures represent different stages of the financial process and should not be treated as interchangeable.
Financial results should reconcile with the accounting system before being used for executive decisions.
3. Freight and Transportation Operations
Transportation performance directly affects customer satisfaction, operating costs and profitability.
A logistics reporting dashboard should give operations managers a clear view of shipment activity and service reliability.
Important metrics include:
- Total shipments handled
- Shipments in transit
- On-time pickup rate
- On-time delivery rate
- Average transit time
- Delayed and exception shipments
- Load utilization
- Empty miles where reliable data is available
- Cost per shipment or load
- Claims and service failures
Managers should be able to filter these metrics by terminal, route, customer, carrier and service type where the underlying data supports those dimensions.
For example, a decline in on-time deliveries may result from a specific terminal, route or carrier rather than a group-wide problem. The dashboard should make that distinction visible.
Operational metrics also need clear definitions. An on-time delivery rate is meaningful only when the organization defines the scheduled delivery time, eligible shipments and treatment of canceled or rescheduled deliveries.
4. Customer and Revenue Performance
A group-wide dashboard should help management understand which customer relationships contribute to sustainable revenue and which require attention.
Useful metrics include:
- Revenue by customer
- Shipment volume by account
- Average revenue per shipment
- Customer retention
- New customer revenue
- Repeat shipping activity
- Customer complaints and claims
- Service performance by account
- Profitability by customer where cost allocation is reliable
Revenue alone does not show whether a customer is profitable.
An account with substantial shipping volume may also require expensive routes, additional handling or frequent service recovery. Comparing revenue with the direct costs of serving that account provides a more useful basis for pricing and account management decisions.
Customer profitability should be presented carefully when shared overhead costs have not been allocated consistently.
5. Workforce and Capacity Reporting
Staffing and transportation capacity affect the group’s ability to handle demand efficiently.
A workforce and capacity dashboard can include:
- Available drivers and operational staff
- Planned versus actual labor hours
- Overtime costs
- Loads assigned versus available capacity
- Equipment utilization
- Maintenance-related downtime
- Unfilled assignments
- Productivity by terminal or team
These metrics can help managers identify whether poor performance comes from insufficient capacity, scheduling problems, equipment downtime or unexpected demand.
Employee-level reporting should be limited to authorized users and used with appropriate context. Productivity figures alone may not reflect route difficulty, shipment complexity or safety requirements.
Key Reporting Dashboard Metrics for Vortex
The following table provides a practical starting point. It represents recommended metrics for a multi-unit logistics operation, not confirmed internal reporting requirements or actual Vortex performance data.
| Reporting area | Core metrics | Main business decision |
|---|---|---|
| Executive | Revenue, margin, growth, target variance | Where should leadership focus? |
| Finance | Operating costs, receivables, cash flow | Where is financial pressure increasing? |
| Freight operations | Shipment volume, delays, on-time delivery | Which routes or terminals need attention? |
| Customer performance | Retention, revenue, complaints | Which accounts need intervention? |
| Workforce | Labor cost, overtime, capacity utilization | Where are staffing or capacity gaps? |
| Service quality | Claims, failed deliveries, exceptions | What is affecting service reliability? |
| Sales | Pipeline, conversion, new accounts | Where are the strongest growth opportunities? |
A dashboard does not need every metric from the beginning. The first version should prioritize the indicators that management uses to make recurring decisions.
How Should Data From Multiple Companies Be Combined?
Consolidating reporting across several business units requires more than placing different spreadsheets into one dashboard.
The underlying data must use consistent definitions and reliable mappings.
Standardize business units and reporting categories
Each company or terminal should have a consistent identifier. Financial accounts, shipment statuses, service categories and customer records should also follow agreed definitions.
For example, if two terminals categorize accessorial charges differently, their revenue and cost reports may not be directly comparable until those categories are mapped consistently.
Connect the relevant systems
Depending on the existing technology stack, data may come from:
- Accounting and enterprise resource planning systems
- Transportation management systems
- Customer relationship management platforms
- Fleet and maintenance software
- Payroll and workforce systems
- Billing and accounts receivable platforms
Integrations should use available APIs, database connections or scheduled exports as appropriate.
A reporting tool cannot produce reliable consolidated results when critical information is missing or outdated in the source systems.
Establish one definition for each metric
Every important KPI should have a documented formula, reporting period, data owner and source.
For example, revenue per shipment could be calculated as eligible revenue divided by completed shipments during the same period. The business must define which revenue categories and shipment statuses qualify.
Without consistent definitions, different departments may report different answers to the same question.
Preserve drill-down and reconciliation
Executives should be able to move from a group-level figure to the relevant company, terminal, transaction or shipment when permissions allow.
Finance teams should also be able to reconcile consolidated totals with approved source reports.
This is particularly important when figures are used for budgeting, financial close or management decisions.
Dashboard Design and Access Requirements
A reporting dashboard should make information easier to interpret, not force users to navigate multiple screens to answer simple questions.
The following design principles are particularly useful.
- Role-based views: Executives see group performance while dispatchers focus on shipment exceptions and finance teams access financial details.
- Clear reporting periods: Every chart should identify the applicable date range and comparison period.
- Visible data freshness: Users should know when each dataset was last updated.
- Consistent visual signals: Use clear status indicators for targets, exceptions and unfavorable trends.
- Practical filters: Allow users to filter by company, terminal, service type, customer and reporting period.
- Mobile accessibility: Managers who work across locations should be able to review essential metrics on smaller screens.
- Export options: Authorized users may need to export data for reconciliation, planning or formal reporting.
The dashboard should also include appropriate authentication, permission controls and audit logging. Sensitive financial, customer and employee data should not be visible to every user simply because it appears in a shared reporting environment.
How Often Should the Dashboard Refresh?
Not every metric needs to update at the same frequency. Refresh schedules should reflect how quickly the underlying business changes and how soon users need to act.
| Data category | Suggested starting frequency | Reason |
|---|---|---|
| Shipment status | Every 15 to 60 minutes where supported | Helps operations teams respond to delays |
| Financial summaries | Daily or according to the accounting close process | Supports consistent financial review |
| Customer reporting | Daily or weekly | Helps monitor account activity and service trends |
| Workforce and capacity | Daily or per shift where data is available | Supports staffing and dispatch decisions |
| Executive scorecard | Daily with formal monthly reporting | Balances current visibility with validated results |
These are planning recommendations rather than verified Vortex requirements. The actual schedule depends on source-system capabilities, data quality, reporting costs and operational urgency.
For example, a shipment dashboard may need frequent updates, while a finalized monthly profit report should wait until the relevant accounting checks are complete.
Every dashboard should distinguish preliminary figures from finalized reporting where that difference matters.
Which Dashboard Technology Fits the Business?
The best reporting platform depends on the systems already in use, the complexity of consolidation and the organization’s technical resources.
Business intelligence platform
A dedicated business intelligence tool is a practical option when the organization needs interactive charts, shared dashboards, filters and connections to several business systems.
It is particularly useful when management needs to compare performance across terminals and companies without manually rebuilding reports.
Existing accounting or transportation software
Built-in reporting may be sufficient when most important data already resides in one system and management needs only a limited number of reports.
This approach can reduce integration work, although it may not provide a complete group-wide view when different companies use separate platforms.
Custom reporting solution
A custom dashboard can make sense when reporting requirements are highly specific or existing systems cannot provide the necessary consolidated views.
However, custom development introduces ongoing responsibilities for data integration, testing, security, maintenance and future changes.
The decision should be based on reporting needs and total ownership cost rather than the number of features a platform advertises.
Expert Decision Framework for Building the Right Dashboard
The most effective way to address Vortex Group of Companies reporting dashboard needs is to define the decisions the dashboard must support before selecting software or designing charts.
A practical evaluation should follow five steps.
Step 1. Identify the most important business decisions
Start by asking what leadership and department managers need to know each week or month.
Examples include identifying declining margins, investigating late deliveries, improving capacity utilization and recognizing customers whose service costs are increasing.
Each dashboard metric should support at least one defined business question.
Step 2. Assess current reporting gaps
Review existing spreadsheets, accounting reports and operational systems.
Identify where information is duplicated, delayed, inconsistent or unavailable. Determine which reports require manual work and which figures are difficult to reconcile.
This assessment will show whether the main problem is software limitations, disconnected data or inconsistent reporting processes.
Step 3. Select a realistic implementation approach
Use the following decision framework to narrow the options.
| Business situation | Recommended approach | Main consideration |
|---|---|---|
| Most reporting needs are covered by one system | Improve existing reports | Avoid unnecessary complexity |
| Several systems need consolidated reporting | Implement a BI reporting layer | Validate integrations and data definitions |
| Complex business rules prevent standard reporting | Evaluate a custom solution | Account for development and maintenance |
| Source data is incomplete or inconsistent | Improve data quality first | A dashboard cannot correct unreliable inputs by itself |
A hybrid approach may also work. For example, the organization could retain its existing accounting software while using a separate dashboard for consolidated operational and financial reporting.
Step 4. Build a minimum viable dashboard
Start with a small set of high-value indicators rather than trying to include every department in the first release.
A sensible initial version could include:
- Group revenue and operating margin
- Revenue and costs by business unit
- Shipment volume and on-time delivery
- Delayed shipment exceptions
- Customer revenue and retention
- Data freshness and reconciliation status
Validate the numbers with the relevant department owners before expanding the dashboard.
Step 5. Measure whether reporting improves decisions
Dashboard success should not be judged by appearance or the number of charts.
Useful measures of success include:
- Time required to prepare recurring reports
- Percentage of reports reconciled successfully
- Number of unresolved data-quality issues
- Time required to identify operational exceptions
- Adoption by intended users
- Frequency with which dashboard insights lead to documented actions
The organization should establish baseline measurements before implementation. That makes it possible to evaluate whether the dashboard actually improves reporting efficiency and decision-making.
Common Reporting Dashboard Mistakes to Avoid
Several implementation mistakes can reduce the value of an otherwise well-designed dashboard.
Combining data without validating it. Consolidated totals can appear correct while underlying records are incomplete or duplicated.
Tracking too many KPIs. Excessive metrics make it difficult to distinguish urgent problems from routine fluctuations.
Ignoring differences between business units. Standard reporting definitions are important, but legitimate operational differences should remain visible.
Using outdated data without warning. Users may act on shipment or financial information that no longer reflects current conditions.
Confusing correlation with cause. A decline in margin and an increase in delays may occur together without one directly causing the other.
Building reports without clear ownership. Every important metric needs someone responsible for its definition, accuracy and interpretation.
Failing to review dashboard adoption. A reporting system provides little value if employees continue maintaining separate spreadsheets because the dashboard does not answer their questions.
Frequently Asked Questions
What are the main Vortex Group of Companies reporting dashboard needs?
The main recommended needs are consolidated financial reporting, freight and shipment visibility, customer performance tracking, workforce and capacity reporting, consistent KPI definitions and secure access to reliable data.
The exact priorities should be confirmed through an assessment of existing systems and management requirements.
Which KPIs should a logistics group track first?
Start with revenue, operating margin, cost per shipment, shipment volume, on-time delivery, delayed shipments and customer retention. These metrics provide a useful initial view of financial performance, operational reliability and customer activity.
Additional KPIs should be introduced when they support a specific decision.
Can one dashboard report on multiple companies?
Yes. A centralized reporting layer can consolidate information from multiple companies and business units when their source data can be connected and mapped consistently.
The system should preserve company-level views as well as group totals and support reconciliation with the original records.
Should financial and operational data appear on the same dashboard?
They can appear in a shared executive dashboard, but detailed financial and operational reporting may be better separated into dedicated views.
Leadership benefits from seeing financial outcomes alongside operational performance, while department teams need more specialized information.
How much does a reporting dashboard cost?
Costs depend on the number of data sources, reporting complexity, software licensing, integration requirements, security controls and ongoing maintenance.
An organization using existing reporting tools may need relatively limited additional investment. A multi-company implementation involving several operational systems may require substantially more planning and development. A reliable estimate requires a defined scope and review of the current technology stack.
How can management verify that dashboard figures are accurate?
Compare dashboard results against approved source reports for the same reporting period and filters. Check for missing records, duplicates, inconsistent account mappings and differences in metric definitions.
Financial totals should reconcile with the appropriate accounting reports, while operational metrics should be checked against the relevant transportation or operational systems.
What is the best first step for improving group-wide reporting?
Document the most important management decisions, identify the reports currently used to support them and establish where the data comes from.
This creates a practical foundation for prioritizing integrations, standardizing metrics and selecting the appropriate reporting technology.
Final Decision: Prioritize Reliable Data Before Expanding Dashboard Features
For Vortex Group of Companies, the most useful reporting dashboard would connect group-wide financial visibility with practical freight and operational insights. Executives need reliable consolidated results, while operations managers need timely information about shipments, capacity and service exceptions.
The strongest starting point is a focused dashboard built around a small set of validated KPIs, supported by consistent data definitions and clear reporting ownership. Once those foundations are reliable, additional features and department-specific views can be introduced according to demonstrated business needs.
The priority should be a reporting system that helps people identify problems, understand their causes and take better decisions, not simply a larger collection of charts.