
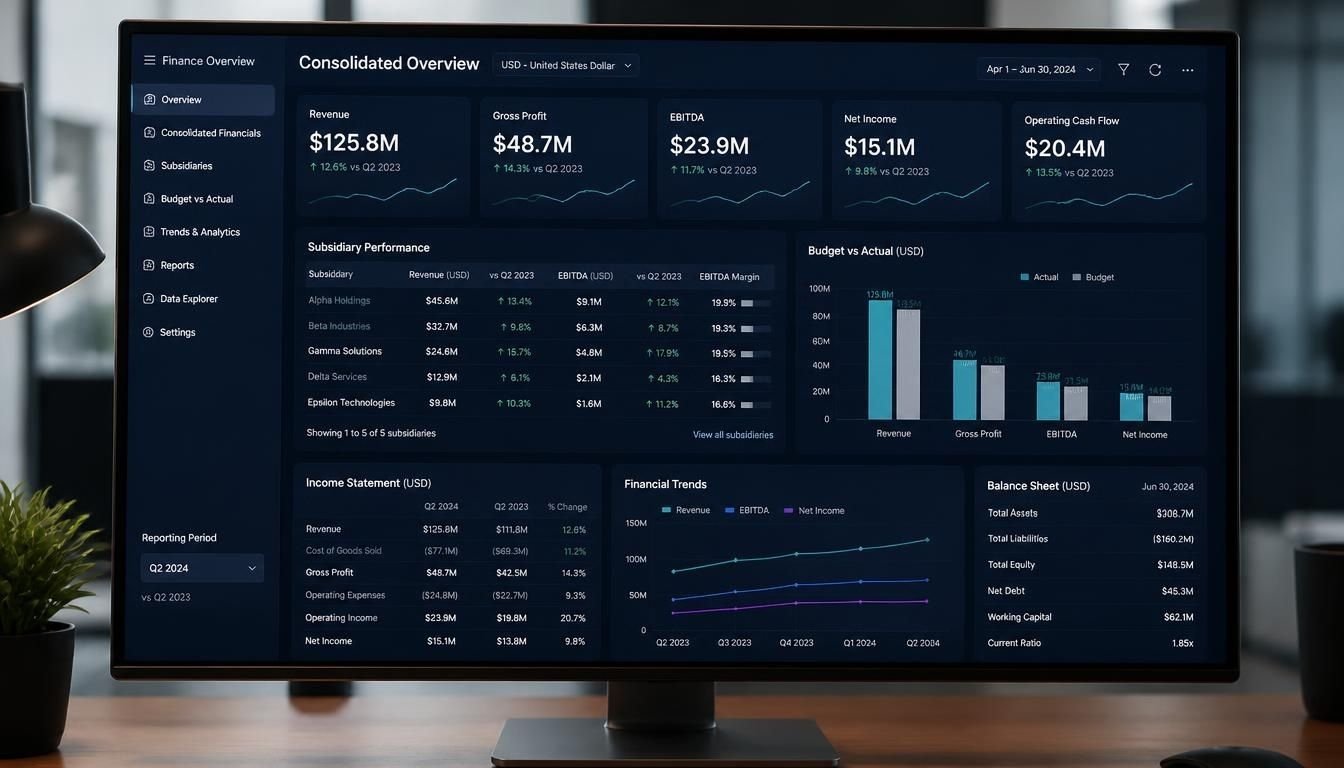
Konsolidator product features reporting dashboards are relevant to finance teams that need a clear view of financial performance across multiple companies or subsidiaries. Instead of combining separate spreadsheets and manually preparing every report, businesses can use consolidated financial data to build reports and dashboards for management decisions.
Konsolidator is a financial consolidation and reporting platform that supports consolidated financial statements, management reporting, budgeting, forecasting and business intelligence. Its reporting capabilities include ready-made templates, Excel integration and Power BI-based reporting options.
The important distinction is that a dashboard is the presentation layer. Reliable financial decisions still depend on accurate source data, correct consolidation rules and appropriate reporting measures.
For a finance director or controller, the goal is not simply to display more charts. It is to identify changes in revenue, profitability, cash flow and subsidiary performance without losing sight of the figures behind those results.
- Konsolidator combines financial consolidation with reporting tools to help finance teams analyze group performance.
- Reporting dashboards can display financial KPIs and consolidated figures across multiple subsidiaries.
- Excel and Power BI integrations support customized reports and deeper financial analysis.
- Drill-down reporting helps teams trace consolidated figures to underlying accounts and transactions where supported.
- The best reporting setup depends on your business structure, data sources, reporting needs and level of analytical detail.
Core Reporting and Dashboard Features in Konsolidator
The platform supports several reporting workflows. Some are available through its standard reporting capabilities, while deeper analytics depend on the BI solution and subscription configuration.
1. Consolidated Financial Statements
Konsolidator helps finance teams combine financial information from parent companies and subsidiaries into a consistent group view.
Common reporting outputs include:
- Profit and loss statements
- Balance sheets
- Cash flow statements
- Financial and operational KPIs
- Actual performance alongside budget and forecast figures
These reports help management assess overall financial performance without treating each subsidiary as an isolated business.
For example, a US company with subsidiaries in several states can review group-level results while maintaining visibility into individual entities. If the group also operates internationally, currency translation becomes another important consideration.
2. KPI Reporting and Performance Dashboards
Key performance indicators turn financial statements into measures that managers can use to evaluate performance.
Depending on the available data and reporting setup, a dashboard may include:
- Revenue and revenue growth
- Operating expenses
- EBITDA and operating margins
- Cash flow performance
- Actual results compared with budget
- Performance by subsidiary or business segment
Not every KPI is automatically available in every dashboard. Some measures require configuration, uploaded data or a customized report.
A useful dashboard should show the current result, a relevant comparison and enough context to explain why the number matters.
For example, revenue growth alone may look positive. However, if operating expenses rise faster than revenue, profitability could decline. Displaying both measures makes the underlying business situation easier to assess.
3. Power BI and Excel Reporting
One of the important Konsolidator product features reporting dashboards users should evaluate is the ability to work with data outside the core consolidation workflow.
Konsolidator supports reporting through Excel and Power BI. Its BI offering includes ready-made reports for financial statements and KPI calculations, with more advanced options for detailed analysis.
Excel can be useful for finance teams that need familiar reporting templates and flexible calculations. Power BI is better suited to interactive dashboards that present financial information visually and allow users to explore different parts of the business.
Typical uses include:
- Monthly management reporting
- Board reporting packages
- Financial statement analysis
- Budget monitoring
- Subsidiary performance comparisons
- Customized KPI dashboards
The choice depends on how much customization and interactivity the business needs. A standard report may be sufficient for routine financial reviews, while a complex group may need additional data modeling and business intelligence capabilities.
4. Drill-Down Analysis and Audit Trails
A consolidated figure is useful only when finance teams can explain where it came from.
Konsolidator supports tracing consolidated figures to underlying accounts. Its BI capabilities can also provide deeper analysis down to transaction-level details, depending on the selected solution and data connections.
This helps finance professionals investigate questions such as:
- Which subsidiary contributed most to a change in group profit?
- Which accounts explain an unexpected expense increase?
- Where did a variance between actual and budget originate?
- Which transactions require further review?
Consider a group whose operating expenses increase unexpectedly in a monthly report. A dashboard may identify the variance, but the finance team still needs account-level or transaction-level information to investigate the cause.
Drill-down reporting reduces the distance between identifying a problem and finding the information needed to resolve it.
5. Reporting Templates and Custom Views
Prebuilt templates can reduce the work required to prepare recurring financial reports.
Depending on the reporting module and configuration, available templates support management reporting, budgeting, forecasting, reconciliation and financial analysis.
Templates are especially useful when the same report must be prepared every month for executives or department heads.
Custom views and report filters can also help users focus on relevant accounts, periods or other reporting dimensions. For example, a finance manager may need to review expenses for a specific business segment rather than the entire group.
Before relying on a template, confirm that its account mappings, reporting periods and calculations match your organization’s reporting requirements.
Reporting Capabilities at a Glance
| Feature | Main purpose | Practical benefit |
|---|---|---|
| Consolidated financial statements | Combine group financial results | One consistent view of group performance |
| KPI reporting | Track important financial measures | Faster performance assessment |
| Excel reporting | Prepare flexible reports | Familiar tools for finance teams |
| Power BI dashboards | Present financial data visually | Interactive analysis and comparisons |
| Drill-down analysis | Investigate underlying figures | Easier variance investigation |
| Reporting templates | Standardize recurring reports | More repeatable reporting processes |
| API access through Konnect | Connect data to external reporting tools | Less manual data transfer |
| Budget and forecast reporting | Compare plans with results | Better financial monitoring |
Availability and functionality vary by product configuration and subscription. Advanced analytics and integrations may require additional setup or a specific plan.
How Finance Teams Can Use Reporting Dashboards
The value of a dashboard depends on how it supports an actual decision. Different users need different levels of detail.
For CFOs and Finance Directors
Senior finance leaders usually need a high-level view of financial health.
A useful executive dashboard might include:
- Group revenue and profitability
- Cash flow trends
- Actual results against budget
- Performance across subsidiaries
- Significant changes requiring management attention
The dashboard should prioritize material changes rather than displaying every available metric. Detailed account analysis can remain available when a result needs investigation.
For Financial Controllers
Controllers need reliable reporting and the ability to investigate discrepancies.
Their reporting setup should make it easier to:
- Compare results across reporting periods
- Check subsidiary figures
- Review account-level details
- Investigate unusual variances
- Prepare recurring financial reports
For this role, traceability and consistent calculations may be more important than visual design.
For FP&A Teams
Financial planning and analysis teams focus on budgets, forecasts and business performance.
Their dashboards may compare actual results with planned figures, track financial trends and highlight areas where forecasts need adjustment.
A dashboard becomes more useful when the measures are connected to the assumptions behind the forecast. A revenue shortfall, for example, should be evaluated alongside relevant cost changes and cash flow implications.
How to Choose Between Standard Reports, Excel and Power BI
Not every organization needs a highly customized dashboard. The right setup depends on the questions users need to answer and how much detail they require.
| Reporting approach | Best suited for | Main limitation |
|---|---|---|
| Standard in-app reports | Routine consolidation and financial reporting | Less flexibility for specialized visual analysis |
| Excel reports | Customized calculations and familiar reporting workflows | Can require manual maintenance if poorly structured |
| Power BI Essential | Ready-made financial dashboards and reports | Focused on predefined reporting needs |
| Power BI Advanced | Deeper analysis across connected financial data | Requires suitable data connections and configuration |
| Power BI Enterprise | Broader reporting across finance and operational systems | More extensive implementation and data modeling may be needed |
Konsolidator’s BI options have different capabilities. Confirm the current plan details before assuming that a particular dashboard, integration or drill-down feature is included.
Which Reporting Setup Fits Your Business?
Choose standard reporting when your primary requirement is to produce consistent financial statements and recurring management reports.
Choose Excel-based reporting when your finance team needs flexible calculations, customized layouts or existing spreadsheet workflows.
Choose Power BI Essential when ready-made visual reporting meets your needs and you want to present consolidated financial data in an interactive format.
Consider Advanced or Enterprise BI when you need deeper transaction analysis, multiple data sources, broader operational reporting or a more comprehensive data model.
The deciding factor should be the complexity of your reporting requirements rather than the number of dashboard features available.
How to Evaluate Konsolidator Dashboard Accuracy
A dashboard can look professional and still provide misleading information if its underlying data is incomplete or incorrectly configured.
Before using reporting dashboards for important decisions, check the following areas.
Verify Source Data and Account Mapping
Confirm that financial information from each subsidiary is complete and mapped to the appropriate group accounts.
Inconsistent account mappings can make comparisons unreliable. A cost category that appears under different accounts in separate subsidiaries may require mapping adjustments before the consolidated results become meaningful.
Check Currency Translation and Consolidation Rules
Groups operating across multiple currencies need appropriate currency translation rules.
Intercompany transactions also require correct treatment so internal transactions do not distort the group’s consolidated financial results.
Review the applicable accounting policies and confirm that the system configuration reflects them.
Validate KPI Calculations
Check how each KPI is calculated and which accounts it includes.
For example, two reports may both display EBITDA but use different adjustments. Comparing the results without confirming the calculation method can lead to incorrect conclusions.
Document the formula, reporting period and data source for each important metric.
Confirm Refresh Timing
A dashboard is only as current as its underlying data.
Determine when financial information is uploaded, consolidated and refreshed in external reporting tools. Confirm that users can identify the reporting period and data status before making decisions.
A report showing last month’s actuals should not be mistaken for a current-period result.
Common Reporting Problems and How to Address Them
| Problem | Possible cause | Recommended action |
|---|---|---|
| Subsidiary figures do not match group totals | Mapping or consolidation differences | Review account mappings and consolidation adjustments |
| Budget comparisons appear inconsistent | Different reporting periods or KPI formulas | Standardize periods and calculations |
| Dashboard data is outdated | Upload or refresh delays | Establish a clear refresh schedule |
| Managers cannot explain a variance | Insufficient detail or drill-down access | Add relevant account-level reporting |
| Excel reports require repeated manual edits | Unstructured reporting workflow | Use consistent templates and supported data connections |
| Reports contain too many metrics | Unclear reporting priorities | Focus on measures linked to actual decisions |
These are general financial reporting issues rather than confirmed defects in the software. Their causes should be investigated within the organization’s own reporting process.
What to Check Before Buying or Expanding Konsolidator Reporting
Before committing to a reporting setup, arrange a demonstration using realistic examples from your own finance workflow.
Ask the provider to demonstrate how the system handles your specific requirements rather than relying only on a standard product presentation.
Your evaluation should cover:
- Data integration: Can the system access the financial data you need from your existing ERP and other systems?
- Reporting detail: Can users move from group figures to subsidiary accounts and transactions where required?
- Customization: Can your team create the reports and KPIs required by management?
- Access controls: Can users access the information appropriate to their roles?
- Refresh workflow: How are new uploads and changes reflected in reports?
- Implementation effort: What setup, data preparation and training will your team need?
- Total cost: Are required BI capabilities, integrations, consulting and additional modules included in the quoted price?
A particularly useful demonstration is a complete reporting scenario. Start with a consolidated financial figure, identify an unexpected variance, drill into the underlying data and show how the result appears in the management report.
This tests the entire workflow instead of evaluating dashboard appearance alone.
FAQs
What are the main Konsolidator product features reporting dashboards offer?
Konsolidator supports consolidated financial statements, KPI reporting, management reports, Excel integration and Power BI-based dashboards. Depending on the selected solution, users can also access deeper financial analysis and connected data sources.
Does Konsolidator support Power BI dashboards?
Yes. Konsolidator offers BI capabilities built around Power BI, including ready-made financial reports and more advanced reporting options. Available functionality depends on the selected BI solution and configuration.
Can Konsolidator reporting dashboards show subsidiary performance?
Yes. Consolidated reporting supports group and subsidiary analysis. The level of detail available depends on the report, data structure and reporting solution.
Can users export financial reports to Excel?
Konsolidator supports Excel reporting and report downloads. Its Konnect API also allows connected reporting workflows to retrieve data for Excel and other supported tools.
Can dashboards compare actual results with budgets?
Konsolidator supports reporting across actuals, budgets and forecasts. The availability and detail of particular comparisons depend on the configured reporting workflow and subscription.
Does Konsolidator support drill-down reporting?
Yes. The platform supports tracing consolidated figures to underlying accounts. More detailed transaction-level analysis is available through applicable BI capabilities and data connections.
Are customized dashboards included with every plan?
Not necessarily. Standard reports and certain BI capabilities are included in the product offering, while advanced data models, integrations and other reporting features may require additional modules or configuration. Confirm the exact scope of your plan.
How should a company test Konsolidator before purchasing?
Use a representative financial reporting scenario that includes consolidated results, subsidiary comparisons, KPI calculations and an investigation of a variance. Verify that the required outputs, data connections and access permissions work as expected.
Decide Which Reporting Capabilities You Actually Need
The most useful Konsolidator product features reporting dashboards provide are the ones that connect reliable consolidated financial data with decisions your team needs to make.
A business that mainly prepares recurring financial statements may be well served by standard reports and Excel templates. A finance team that needs interactive performance analysis may benefit from Power BI. Groups requiring detailed transaction analysis or data from several business systems should evaluate the more advanced BI options.
Before selecting a plan, identify your essential reports, define the KPIs management uses, and test how easily users can trace important figures back to their underlying data. That approach helps you choose a reporting setup that fits your real requirements without paying for unnecessary complexity.